
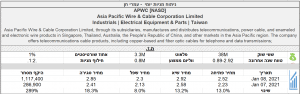
Asia Pacific Wire & Cable Corporation Limited, through its subsidiaries, manufactures and distributes telecommunications, power cable, and enameled and electronic wire products in Singapore, Thailand, Australia, the People's Republic of China, and other markets in the Asia Pacific region. The company offers telecommunications cable products, including copper-based and fiber optic cables for telephone and data transmissions; and armored and unarmored low voltage power transmission cable, which is used to transmit electricity to and within commercial and residential buildings, as well as to outdoor installations, such as street lights, traffic signals, and other signs. It also provides enameled wire for use in the assembly of a range of electrical products consisting of oil-filled transformers, refrigerator motors, telephones, radios, televisions, fan motors, air conditioner compressors, and other electric appliances. In addition, the company distributes wire and cable products; and offers project engineering services in the supply, delivery, and installation of power cables, as well as fabrication services for converting raw materials to wire and cable products. It serves government organizations, electric contracting firms, electrical dealers, and wire and cable factories. The company was founded in 1996 and is headquartered in Taipei, Taiwan. Asia Pacific Wire & Cable Corporation Limited is a subsidiary of Pacific Electric Wire & Cable Co., Ltd.
ת.ז.
| שווי שוק | 38M | פלאוט | 3.3M | אחוז שורטיסטים | 1% |
| טווח שנה אחרונה | 0.89-2.92 | ווליום ממוצע | 0.8M | חילוף מניות | .1:2. |
נתונים היסטורים
| תאריך | מחיר פתיחה | מחיר שיא | מחיר שפל | מחיר סגירה | היקף מסחר |
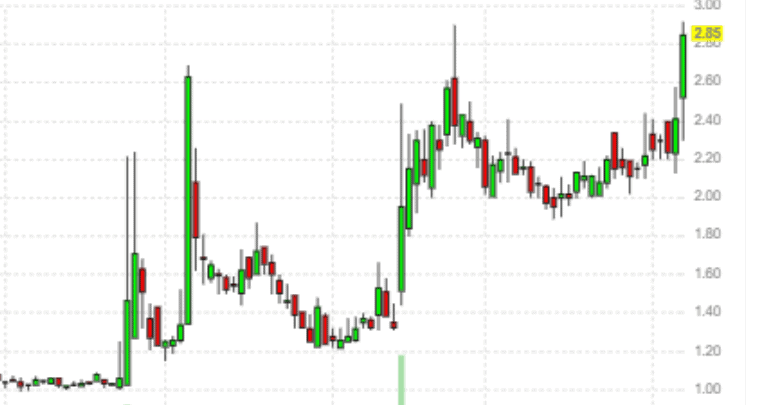
| Jan 08, 2021 | 2.52 | 2.92 | 2.3 | 2.85 | 1,117,400 |
| Jan 07, 2021 | 2.23 | 2.58 | 2.13 | 2.41 | 286,900 |
| שינוי | 13.0% | 13.2% | 8.0% | 18.3% | 289% |
ניתוח טכני
| יתרונות | חסרונות | ציון | |||
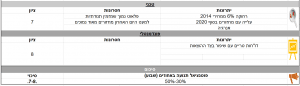
| רחוקה 6% ממחירי 2014 | פלאוט נמוך שמזמין תנודתיות | 7 | |||
| עלייה עם מחזורים בסוף 2020 | למעט היום האחרון מחזורים מאוד נמוכים | ||||
| אנרגיה | |||||
ניתוח פנדומנטלי
| יתרונות | חסרונות | ציון | |||
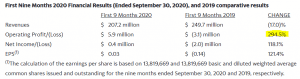
| דו"חות טובים עם שיפור בצד ההוצאות | 8 | ||||
סיכום
| פוטנציאל תנועה באחוזים (שבוע) | סיכוי | ||||
| 50%-30% | .7-8. | ||||
- שווי השוק – Market Cap – כמה החברה שווה – כמות המניות כפול מחיר המניה
- טווח שנה אחרונה – 52w range – טווח מחירים של המניה במהלך ה-52 שבועות האחרונים (שנה).
- פלאוט Shs Float– – כמות המניות הזמינות למסחר
- ווליום ממוצע Avg Volume– – מציג את ממוצע מחזורי המסחר במניות נכון לתקופה של 3 החודשים האחרונים
- אחוז שורטיסטים – – Short Float – כמות המניות המוחזקות בפוזיציית שורט מתוך כמות המניות הסחירות (באחוזים)
- קצב חילוף מניות – הסבר מפורט בלינק הבא: https://www.youtube.com/watch?v=2Zf28MjnMt8
- פוטנציאל תנועה באחוזים – מהמחיר הגבוה לנמוך – התנועה יכולה להיות עלייה או ירידה
***אין באמור המלצה לקניה או מכירה של ניירות ערך, הכותב עשוי להחזיק בנייר וזהו אינו תחליף לייעוץ פרטני המותאם לצרכיו האישיים של כל אדם